Back مجموعة بيانات فيشر Arabic Conjunt de dades de flors Iris Catalan Schwertlilien-Datensatz German Conjunto de datos flor iris Spanish مجموعه داده گل زنبق Persian Iris de Fisher French Iris flower data set Hungarian Dataset Iris Italian Conjunto de dados flor Iris Portuguese Ирисы Фишера Russian

The Iris flower data set or Fisher's Iris data set is a multivariate data set used and made famous by the British statistician and biologist Ronald Fisher in his 1936 paper The use of multiple measurements in taxonomic problems as an example of linear discriminant analysis.[1] It is sometimes called Anderson's Iris data set because Edgar Anderson collected the data to quantify the morphologic variation of Iris flowers of three related species.[2] Two of the three species were collected in the Gaspé Peninsula "all from the same pasture, and picked on the same day and measured at the same time by the same person with the same apparatus".[3]
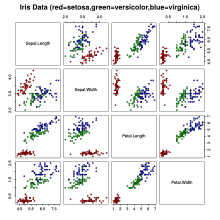
The data set consists of 50 samples from each of three species of Iris (Iris setosa, Iris virginica and Iris versicolor). Four features were measured from each sample: the length and the width of the sepals and petals, in centimeters. Based on the combination of these four features, Fisher developed a linear discriminant model to distinguish the species from each other. Fisher's paper was published in the Annals of Eugenics (today the Annals of Human Genetics).[1]
- ^ a b R. A. Fisher (1936). "The use of multiple measurements in taxonomic problems". Annals of Eugenics. 7 (2): 179–188. doi:10.1111/j.1469-1809.1936.tb02137.x. hdl:2440/15227.
- ^ Edgar Anderson (1936). "The species problem in Iris". Annals of the Missouri Botanical Garden. 23 (3): 457–509. doi:10.2307/2394164. JSTOR 2394164.
- ^ Edgar Anderson (1935). "The irises of the Gaspé Peninsula". Bulletin of the American Iris Society. 59: 2–5.
© MMXXIII Rich X Search. We shall prevail. All rights reserved. Rich X Search